
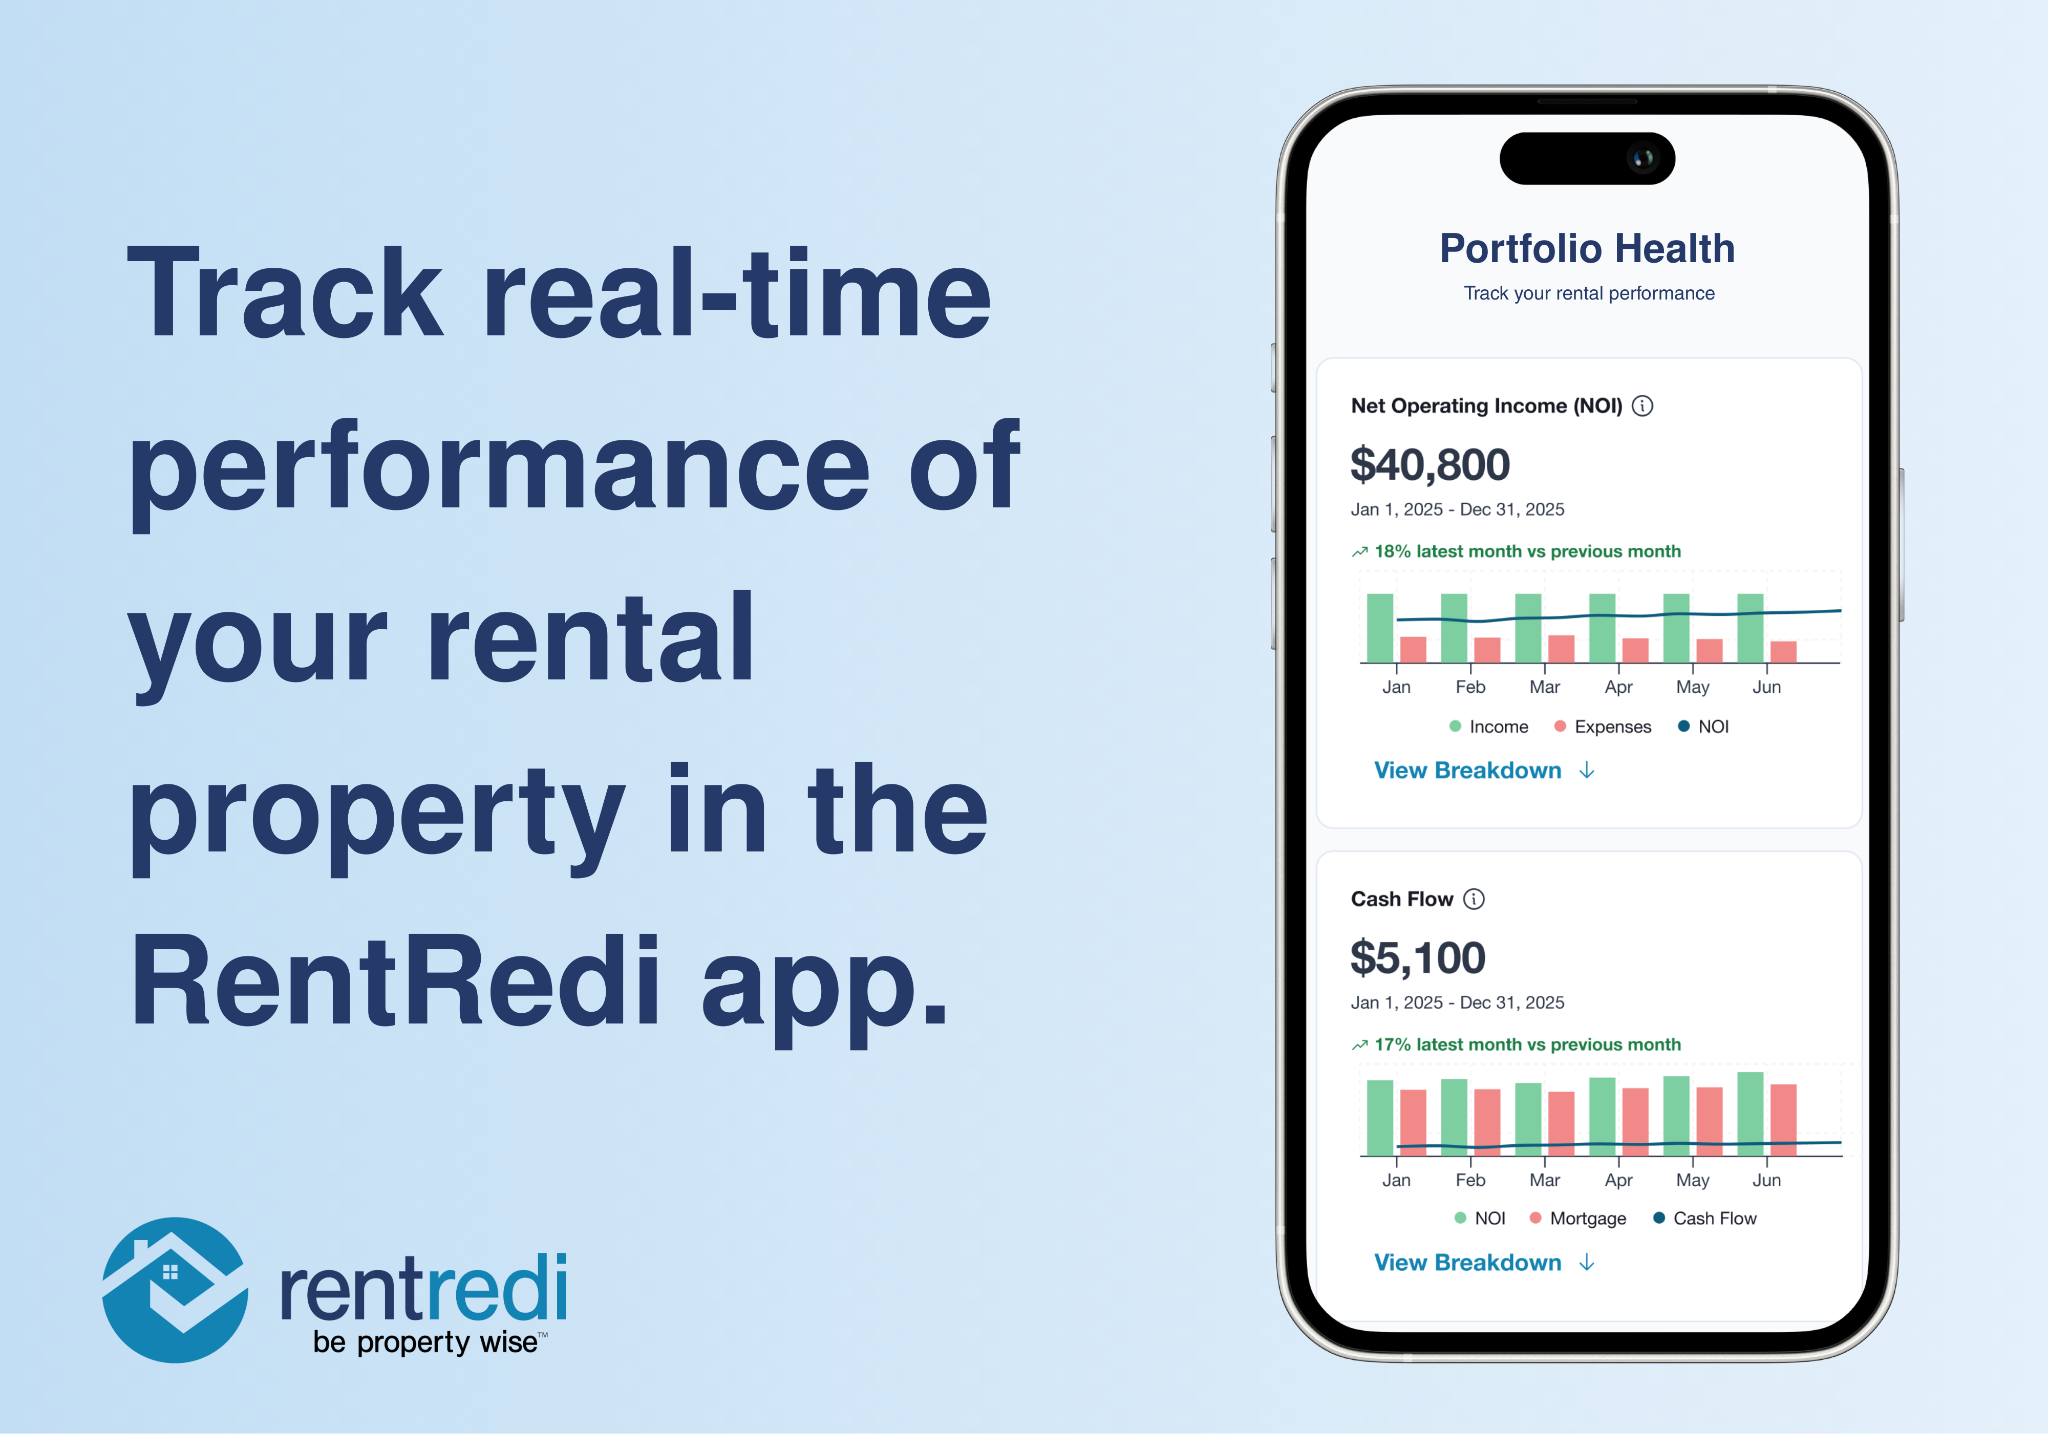
RentRedi has launched Portfolio Performance, a new analytics dashboard that helps independent landlords track the financial health of their rental properties in real time. The dashboard visualizes four key investment metrics landlords rely on to evaluate performance: Net Operating Income (NOI), cash flow, cash-on-cash return, and estimated equity.

The financial analystics tool is designed specifically for independent “mom-and-pop” rental owners who often manage properties themselves and typically rely on spreadsheets to track ROI. Portfolio Performance pulls data directly from rent collection, maintenance costs, tenant activity, and accounting records to create a live snapshot of property performance across a portfolio or at the individual property level.
A few highlights that may be of interest to your readers:
- Real-time investment analytics for small landlords: Tracks NOI, cash flow, cash-on-cash return, and equity growth in one dashboard.
- Portfolio and property-level visibility: Landlords can compare how each property is performing and identify where to reinvest or adjust strategy.
- Automated ROI calculations: The platform connects rent payments, expenses, and mortgage data to eliminate manual spreadsheets.
- Early risk detection: Visibility into expenses and returns helps landlords catch performance issues before they grow.

RentRedi Launches Rental “Portfolio Performance” Dashboard to Help Landlords Track Real-Time Rental Property Equity and Health
New property performance metrics dashboard gives rental owners financial X-ray vision into NOI, cash flow, cash-on-cash return, and equity.
NEW YORK, NY, March 11, 2026 — RentRedi, the fastest-growing property management software built for smart real estate investors, announced the launch of Portfolio Performance, a financial analytics suite designed to help landlords visualize, monitor, and grow their rental business in real time. Portfolio Performance analyzes data from rent collection, maintenance coordination, and accounting to provide a unified view of the financial health of a rental property in a single dashboard.

RentRedi’s Portfolio Performance dashboard is a data visualization tool that gives landlords a live snapshot of four metrics that matter most when building wealth through a rental property or portfolio:
- Net Operating Income (NOI)
- Cash Flow
- Cash-on-Cash Return
- Estimated Equity
Portfolio Performance helps landlords move beyond collecting rent and toward actively managing long-term return on investment (ROI).
From Rent Collection to Real-Time ROI Tracking
Independent landlords evaluate income, expenses, and long-term appreciation when planning wealth-building strategies. The RentRedi Portfolio Performance delivers a faster, clearer way to see those numbers working together: your true monthly return, your growing equity position, and how this year’s performance stacks up against last year.
RentRedi’s Portfolio Performance dashboard was built to provide clear, confident answers to questions about actual monthly returns, equity, and year-over-year property performance. It brings your financial picture into focus in one place, so you can evaluate your investment and make decisions backed by real-time data (rather than estimates or spreadsheets).
“Portfolio Performance marks the next chapter for independent landlords,” said RentRedi Founder and CEO Ryan Barone. “With real-time insight into cash flow, expenses, equity growth, and ROI across their portfolio, landlords finally see exactly how their investments are performing. That visibility helps them move faster, reinvest smarter, and drive stronger performance across every property they own.”
View this video to see how the RentRedi Portfolio Performance dashboard works: https://www.youtube.com/shorts/N0hxqHR2aP4
By connecting rent payments, expense tracking, and mortgage details, Portfolio Performance automatically calculates:
1. Net Operating Income (NOI)
NOI is gross rental income minus operating expenses (including taxes, insurance, repairs, and utilities), but before mortgage payments. NOI is one of the most important metrics in real estate because it reveals the core profitability of a rental property by showing whether the asset itself is performing independent of financing.
The NOI section of the RentRedi Portfolio Performance dashboard pulls operating expenses directly from accounting and expense tracking tools, ensuring calculations update dynamically as landlords log transactions. Repairs and maintenance costs entered through RentRedi’s maintenance management system also flow into the NOI section of the dashboard, giving landlords a real-time look at how property upkeep impacts performance.
2. Cash Flow
Cash flow is the money left after operating expenses and mortgage payments are paid. It shows what the property is actually producing each month in pre-tax income. While NOI measures asset performance on its own, cash flow reflects the real-world impact of both operations and financing, making it one of the clearest indicators of how an investment is performing today.